
The Google Analytics errors that send you after the wrong problem
I spent months improving a number that turned out to be mostly bots. Most analytics problems don't look like errors, they look like performance.

A few years back I spent months pointing an entire SEO strategy at one number in Google Analytics: time on site. Internal linking, category copy, a proper related products block, all of it aimed at nudging that figure up. It moved. Conversions didn’t.
Two things were wrong. Time on site is ambiguous to begin with, and we were reading one blended figure across blogs, collections and product pages, so a long session on a blog post and a shopper who couldn’t find the delivery information looked identical. Underneath that, a chunk of the sessions weren’t people at all. Bots, in and gone in under a second, pulling the average down.
Months of work aimed at a problem we didn’t have, and we should have caught it far earlier. It isn’t a rookie error, though. It’s what happens to anyone who trusts a number without checking what’s underneath it, and after fifteen years in Google Analytics accounts I’d say it’s the most expensive common mistake in ecommerce.
Worth knowing the scale of the bot problem. Thales put automated traffic at 53% of all internet traffic in 2025, and 40% of the total was bad bots rather than search engine crawlers. That’s measured across the sites Imperva protects rather than the whole web, so treat it as an indication rather than gospel, but it isn’t a rounding error.
Broken reporting doesn’t look broken
Analytics gets configured once. Usually at launch, usually by an agency or a developer, and often by someone who has since moved on. Then it gets read every week for years while the business changes around it. New channels appear. A migration happens. A platform update switches something off.
The number is visible. The setup isn’t. So when something moves, the site gets the blame or the credit, and nobody thinks to ask whether the number is still measuring what it was measuring last year.
That’s what makes this expensive rather than just annoying. It looks exactly like a real result, and it sends you after a problem you haven’t got.
A broken report doesn’t show you an error. It shows you performance.
Some numbers aren’t broken, they’re just averages
Not everything that misleads you is a misconfiguration. Your sitewide conversion rate is a number nobody experiences. Split it by channel and it comes apart: social usually converts poorly, direct converts far better, paid sits somewhere else again. The blended figure describes none of them, and when it moves it’s usually telling you your traffic mix changed rather than your site got better or worse.
A blended conversion rate is a number that describes nobody.
Same failure as my bot sessions, in a different costume. One number covering two different realities, and a decision made on the wrong one.
What to check when a number moves
This is the list I work through when I take over an account, written as symptoms rather than settings, because the symptom is the bit you’ll actually notice.
Revenue drops to almost nothing overnight, but sessions and add to carts look normal.
Your purchase tracking has stopped, not your sales. Worth checking this week rather than next: Shopify is switching off Additional Scripts and checkout.liquid for non-Plus stores on 26 August 2026, Plus stores went last year. If your purchase tracking still runs through there, it stops this month without warning.Your analytics revenue is roughly double what Shopify’s admin says.
Two things are tracking the same purchase, usually a manual setup running alongside Shopify’s own Google channel. Conversion rate looks twice as good as it is.Engagement rate falls off a cliff and you changed nothing.
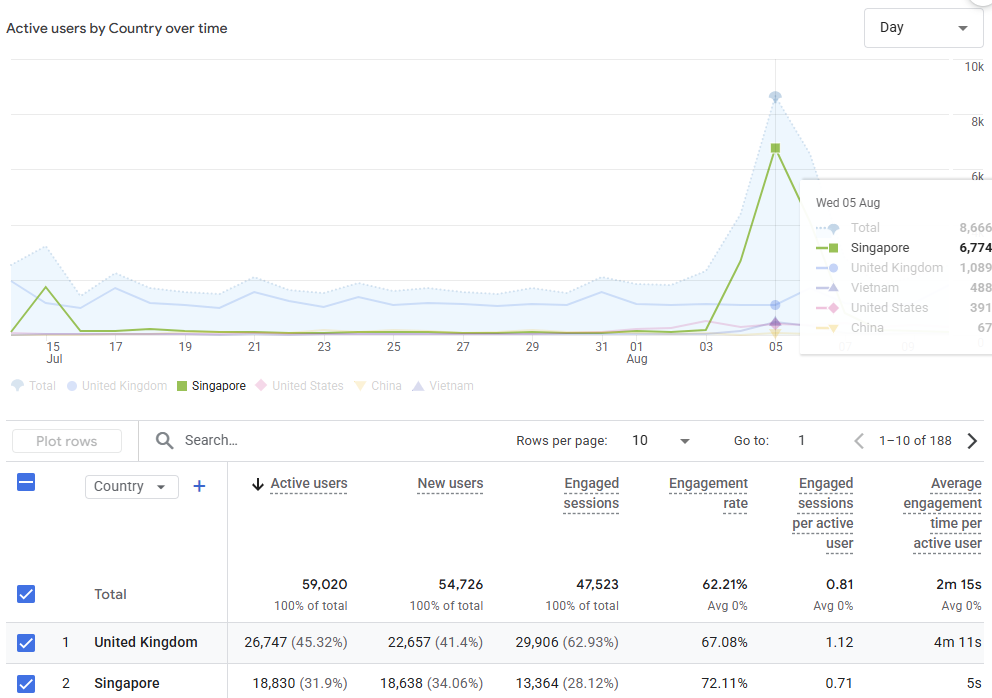
Look at your top countries. Bot traffic from markets you don’t sell to lands, bounces in under a second, and drags every average down with it (like in the first screenshot).Email looks like it’s underperforming.
Check whether it’s actually landing in email. Klaviyo and friends turn up under referral or unassigned more often than not, so the channel gets judged on a fraction of its real numbers.Paid search looks empty while you’re spending on ads.
The tracking parameter is being stripped somewhere between the click and the page, so Google is counting your paid traffic as organic.A channel that’s growing doesn’t appear to exist.
AI traffic arrives as referral with nowhere sensible to sit, so it stays invisible until you group it. Adobe put AI-sourced traffic to US retail sites up 393% year on year in the first quarter of 2026, so it’s worth finding. I’ve written up how to group it in GA4 here.Your bestsellers appear to have stopped selling and the product table doesn’t add up to your revenue.
There’s an ‘other’ row probably absorbing them.Every pageview total is an even number.
Two tags are firing. If you can never find an odd number, something is doubling.
What it costs
Months, in my case, and that was only my time. For a brand it’s worse than that.
If your purchase tracking goes down this month, you spend the run up to peak trading unable to see which channel is producing revenue, at the exact point in the year when that’s the only question that matters. The orders still come in. You just won’t know where to put the next five thousand pounds.
The quieter version is a channel getting starved. Email lands in unassigned, so it looks like it isn’t working, so it gets less attention and less budget, and the reports keep confirming the decision that caused it. Nothing in that loop ever announces itself as an error.
The order to do it in
When a number moves and you don’t know why, the pull is to go straight to the site. Resist it, and do these three in order.
Date the movement. Not ‘traffic is down this quarter’ but the week, or ideally the day, it changed.
Find out what changed in your setup on or around that date. A migration, a theme update, a new app, a tag added, a campaign switched on, a platform deprecation.
Only then look at the site.
Most of the time you’ll have your answer at step two, and it’ll have taken ten minutes.
How to improve your setup
Treat the reporting setup as something that needs checking rather than something that was set up once. Once a quarter, open the account and confirm the filters are still right, the channels are still grouped properly, and the revenue figure still reconciles with your platform. It’s the same instinct as checking the payment gateway still works. Nobody assumes that’s fine forever either.
A shortcut on top of that. GA4 is a miserable thing to sit in front of, so I don’t ask clients to. I build the reporting in Data Studio instead, with the country filters already applied and everything you actually need on a handful of pages. Same data, far less clicking about, and nobody has to remember to apply a filter because it’s built in.
The last piece is making peace with measurement getting worse rather than better. Between privacy controls, cookie blockers and consent, you see less than you did five years ago and you’ll see less again in five more. Chasing a complete dataset is chasing something that isn’t coming. Anchor on revenue, which you can always reconcile against your own platform, and treat everything else as directional.
That’s the whole discipline. Not better data. Knowing which of your numbers you’re allowed to act on.
This week’s focus
Open your analytics, set the date range to the last twelve months, and look at your top countries. If there are markets in there you don’t sell to, every average you’ve read this year has been blended with them.
Set up filtered views so that you only see the data for your target market.
Which number are you managing to that you’ve never checked the setup behind?